
How vehicle classification analytics and vehicle type detection work, which classes to use in Singapore, and how to plan camera placement, integration and data.
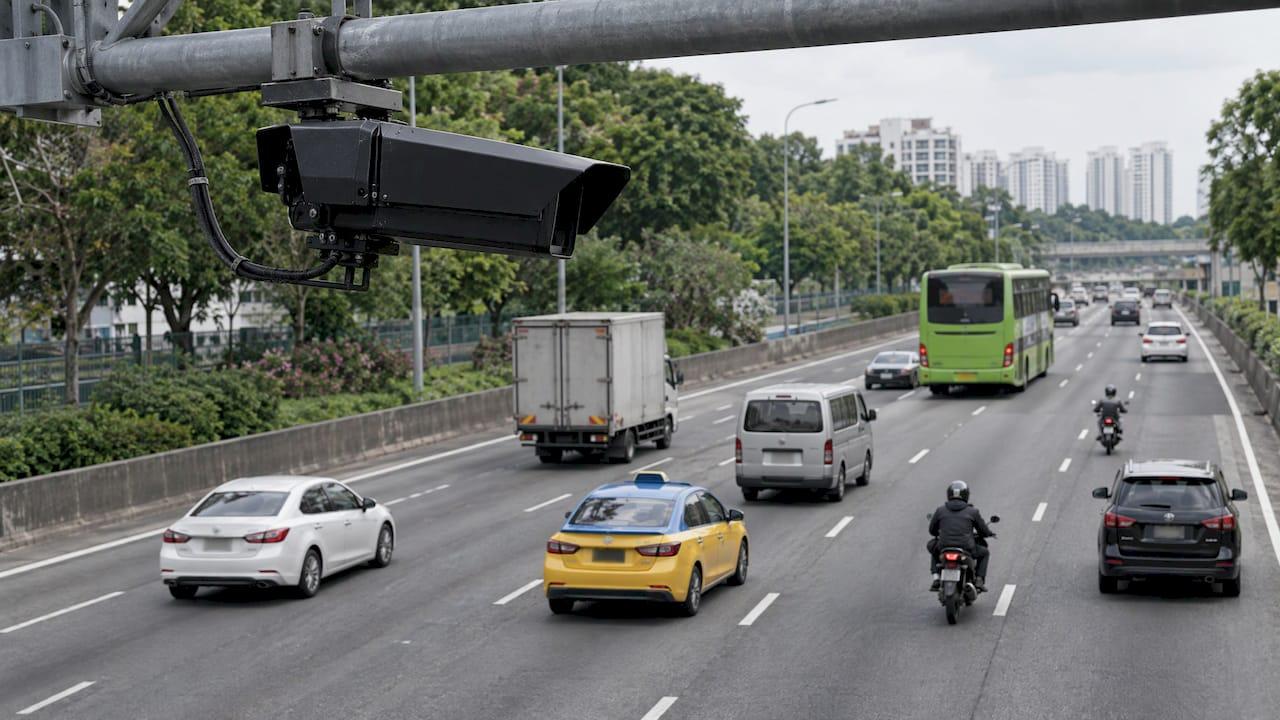
Vehicle Classification Analytics: A Guide for Singapore Sites

Vehicle classification analytics turns camera video into counts of vehicle types: cars, vans, lorries, buses, motorcycles. For a security or facility team, the value lies in the decision it supports: which gate needs a heavy-vehicle lane, when delivery traffic peaks, which vehicle class is entering a restricted zone. The accuracy of any deployment depends on three choices made before the first camera is mounted: the class list, the camera geometry and the integration path into your existing security operations. This guide covers all three for Singapore sites. We build AI-powered surveillance and video analytics solutions at BeyondSensor, and the same planning logic applies whether you run a logistics yard, a campus or a government facility.
TL;DR
- Vehicle type detection finds a vehicle in the frame and assigns it a coarse class such as car, bus or truck. The output is statistical, not tied to an individual driver.
- Choose your class list from the decision you need to make. Singapore's LTA categories are a useful starting vocabulary, but a site rarely needs all of them.
- Camera placement, lighting and weather decide real-world accuracy more than the model name on the datasheet.
- Classification becomes operational when it feeds your SOC or access control, with alerts on exceptions rather than a wall of counts.
- Plan the deployment with an integrator who can handle multi-vendor hardware and local validation from the start.
Table of Contents
- What vehicle classification analytics actually is
- How the detection and classification step works
- Choosing your vehicle classes
- What the output looks like and how to use it
- Planning a deployment that holds up in Singapore conditions
- Common failure points
- Our perspective
- How we can help
- FAQ
- Sources
What vehicle classification analytics actually is
The term covers a family of tasks. A 2017 review in ACM Computing Surveys sorts automated vehicle classification by granularity into three levels: vehicle type recognition, vehicle make recognition, and make and model recognition. Each level asks for more detail from the image and more from the training data.
For most security and facility work, the first level is the one that matters. Ni and Huttunen (2020) describe vehicle type recognition as coarse-grained categorization by size or usage, such as sedan, bus or truck. They note a common use is computing the distribution of vehicle categories at a checkpoint, and that the results are purely statistical, for example the share of traffic on a road that is buses. That framing helps with governance: you are measuring the mix of traffic, not profiling a person.
Two terms you will meet in vendor material:
- Vehicle detection answers "is there a vehicle, and where is it in the frame?"
- Vehicle classification answers "what kind of vehicle is it?" Detection comes first, classification follows, and most modern systems do both in one pass.
"Vehicle type detection" and "vehicle classification" are used almost interchangeably in practice. Analytics is the layer on top: counting, dwell time, direction, time-of-day patterns and alerts built from the classified detections.
How the detection and classification step works

Older systems relied on hand-crafted image features, with names like HOG, Haar and LBP. A 2023 survey in PMC by Berwo and colleagues explains that deep learning approaches, including convolutional and region-based neural networks, improve detection accuracy, precision and robustness over those features, which fail to provide a general solution. That is why current deployments are built on deep neural detectors.
In plain terms, the pipeline looks like this:
- Capture. A fixed or PTZ camera streams video.
- Detect. A neural network draws a box around each vehicle and gives it a class label with a confidence score.
- Track. The system links the same vehicle across frames so it is counted once, not once per frame.
- Aggregate. Counts by class, direction, lane and time window are produced.
- Act. Rules fire alerts, or the data goes to a dashboard or another system.
The confidence threshold in step 2 is a design decision. A low threshold catches more vehicles and more false positives. A high one is cleaner but misses vehicles in rain or at night. Set it against the cost of a miss at your site, not against a generic benchmark.
Choosing your vehicle classes
The most common planning mistake is adopting a long class list because the model supports it. Every extra class lowers the separation between neighbours: a van and a small lorry look similar from a front-on gate camera, and a larger taxonomy will blur them.
Start from the decision. Ask what you will do differently when the class changes.
| Site decision | Classes usually enough |
|---|---|
| Separate heavy-vehicle lane at a logistics gate | Car, van, lorry or truck, bus |
| Flag trucks in a pedestrian or after-hours zone | Truck versus everything else |
| Visitor and staff car park planning | Car, motorcycle |
| Shuttle and coach scheduling | Bus versus other |
| Corridor traffic mix for a campus | Car, motorcycle, van, lorry, bus |
Where Singapore's official categories fit
LTA's categories are a sensible vocabulary to map to, particularly if you will exchange data with public agencies. In a report published on 14 November 2026, The Straits Times said LTA's new road video platform will classify vehicles into cars, taxis, vans, light goods vehicles, heavy goods vehicles, public and private buses, and motorcycles.
Note what this means for your design. Some of those distinctions are visual: a motorcycle is not a bus. Others are regulatory or commercial: a taxi and a private-hire car can look identical, and a light goods vehicle and a heavy goods vehicle are separated by weight, which a camera estimates from size and shape. If your decision depends on a legal category, treat the camera class as a strong indicator and confirm with another signal, such as the plate read or an access credential.
Public datasets show the typical camera-side class list. The open CATI expressway dataset on Hugging Face records per-camera counts for car, motorcycle, bus, truck, van and lorry from LTA expressway cameras. It is a useful reference for how a class list is laid out in practice.
What the output looks like and how to use it
Classification analytics can produce several kinds of output. Which ones you want shapes the dashboard and the alert rules.
- Counts by class and time window. Hourly or daily volumes by type, used for lane planning and shift scheduling.
- Direction and lane splits. Inbound versus outbound, or which bay a vehicle used.
- Speed and dwell. How long a vehicle stays in a zone, and whether it moves at an unusual pace.
- Exceptions. A truck entering at 3 a.m., a bus in a zone closed to buses, a motorcycle in a vehicle-only lane.
- Anomalies. Sudden jumps in vehicle count that suggest congestion or an incident.
The LTA example shows the scale at which this is heading. According to the same Straits Times report, the platform will consolidate CCTV footage from arterial roads, expressways and road tunnels, use video analytics to detect incidents, count traffic volume over various time periods, record average speeds, and process at least 960 video streams at once. It is planned for staged rollout from 2028, with the tender expected to be awarded in the second quarter of 2027, and it will also build incident timelines and highlight hot spots. For a facility team, the lesson is the pattern, not the scale: consolidate video, classify and count, then surface the exceptions.
That last point is where operations teams gain the most. A dashboard of counts is a report. An alert on a vehicle class that should not be there is a control. We favor exception-based monitoring: the system watches every frame, and your operators look only at what breaks the rule.
Planning a deployment that holds up in Singapore conditions
Camera placement and geometry
A 2019 arXiv survey by Won notes that over-roadway camera-based systems are the most prevalent vehicle classification technology. Whatever the mounting, a few rules apply:
- Mount high enough to see the vehicle's full profile, with minimal occlusion from the vehicle ahead.
- Keep the angle consistent across cameras that feed the same model. A model validated at one angle degrades at another.
- Decide the zone of interest in advance, such as a lane, a gate throat or a loading bay, and frame for it.
- Allow for the tropical weather pattern: heavy rain, glare on wet surfaces and low evening light all change what the camera sees.
If you also need plate reads at the same point, the geometry and lighting requirements differ from classification. Our guide to camera geometry and IR lighting for license plate recognition covers those constraints, and the two can share a gate design if planned together. For moving or wide areas, PTZ auto tracking can follow a vehicle of interest once a rule triggers.
Day, night and rain
Field conditions are where lab numbers and site numbers part ways. The PatrolVision paper on arXiv built a Singapore license plate system on a 16,910-frame dataset of 1920×1080 street video collected over three months in day, night and rain. It reported 86% precision on plate detection and 89% accuracy on full plates when allowing one incorrect character, running at 64 frames per second on a Tesla P4 GPU. The numbers belong to that task and dataset, but they show the right habit: validate on your own footage across lighting and weather, not on a clean sample.
Privacy and data handling
The statistical nature of type classification helps. Because the output is a class and a count rather than an identity, it is easier to align with data-minimization practice. Won's survey also notes that some systems address driver privacy by using alternative sensors such as infrared sensors and laser scanners rather than visible-light cameras. If your site has sensitive zones, this is a design option to raise early. Where plates are read, treat them as personal data under Singapore's regime and agree retention and access with your data protection officer.
Integration with the rest of the security stack
Classification that stays in its own screen gets ignored. Plan the connections:
- Video management system (VMS): the analytics should consume existing streams, not require a second camera layer where avoidable.
- Access control: a gate barrier decision may combine class, plate and credential.
- SOC dashboard: exceptions should land in the same console your operators already watch.
- Reporting: weekly mix by class for facility planning.
Multi-vendor environments are the norm in Singapore, with cameras from one maker, a VMS from another and access control from a third. The integration path deserves as much planning as the model. Related analytics you may already run, such as occupancy analytics and heatmap analytics, share much of the same infrastructure, so a vehicle pilot can reuse camera coverage and dashboards you have built.
Run a pilot before you scale
A short pilot on one gate or one lane tells you more than any datasheet. Define the classes, set a measurable pass criterion such as agreement with a manual count over a fixed period, include a rainy day and a night shift, and review the false alerts with your operators. The same approach appears in our write-up on a two-week pilot for loitering detection analytics, and the structure carries over directly.
Common failure points
| Failure | Cause | Planning response |
|---|---|---|
| Vans counted as cars | Camera angle hides the vehicle's length | Raise the mount or change the class list |
| Double counting | Weak tracking across frames | Define a counting line and test with dense traffic |
| Night misses | Poor illumination, low confidence | Add lighting or tune thresholds with night footage |
| Alert fatigue | Too many classes, loose rules | Alert only on the exceptions that need action |
| Dashboard unused | Not wired into SOC workflow | Integrate with the console operators already use |
Our perspective
Most vehicle analytics projects fail at the boundary between systems, not inside the model. A classifier that is right 9 times out of 10 is useful if its exceptions reach the right operator in seconds. It is wasted if the output lives in a separate tool nobody opens.
That is why we build around a unified, automated platform with multi-vendor integration and localized technical validation for Southeast Asia. Sites in Singapore, Malaysia and the Philippines do not share one camera estate, one regulator or one climate, and a deployment plan should reflect that from day one.
Our view is that AI never blinks, so the job of your people should be judgment, not watching. Let the system classify and count continuously, set rules that raise only exceptions, and keep your operators for the decisions that need them.
Eumir
How we can help
If you are scoping vehicle classification for a gate, a yard or a campus, our Solution Integration service is the place to start: we work with security solution providers and integrators on multi-vendor deployments. Our AI-powered surveillance software and video analytics dashboards sit on the BeyondWatch line, and for integrators who want to bring this capability to their own clients, SI Channel Enablement is built for that route.

To discuss your site and the classes you need, start from the BeyondSensor home page.
FAQ
What is the difference between vehicle detection and vehicle classification?
Detection finds a vehicle and its position in the image. Classification assigns it a type, such as car, bus or truck. Most current systems do both in a single pass using a deep neural network, and the classification result is a coarse category rather than an identity.
Which vehicle classes should I configure?
Start from the decision you want to change. A heavy-vehicle gate lane may need only car, van, lorry and bus, while a car-park study may need only car and motorcycle. Fewer classes mean cleaner separation. If you need to exchange data with public agencies, map your classes to LTA's categories.
Can the system tell a heavy goods vehicle from a light goods vehicle?
The camera estimates size and shape, which correlates with weight but does not measure it. For decisions that depend on a legal weight category, combine the camera class with a plate read or an access credential, and validate the result on your own gate footage.
Does vehicle classification raise privacy concerns?
Type classification produces statistics such as the share of buses in traffic, not details about an individual driver. Where you also read license plates, agree retention periods and access rules with your data protection officer before go-live.
How long should a pilot run?
Long enough to include a night shift and a wet day, so the thresholds are tested against the conditions that cause misses. Compare the system's counts with a manual count and review false alerts with your operators before scaling to more cameras.
Sources
- Automated Vehicle Detection and Classification: Models, Methods, and Techniques (ACM Computing Surveys, 2017)
- Vehicle Attribute Recognition by Appearance (Journal of Signal Processing Systems, 2020)
- Deep Learning Techniques for Vehicle Detection and Classification (PMC, 2023)
- LTA upgrades road video platform to detect incidents (The Straits Times)
- CATI Singapore Expressway Traffic Dataset (Hugging Face)
- Intelligent Traffic Monitoring Systems for Vehicle Classification (arXiv, 2019)
- PatrolVision: Automated License Plate Recognition (arXiv, 2025)
Recommended
Read More Articles
CCTV Tender Specifications in Singapore: What to Write and Check
How to write or answer a CCTV tender specification in Singapore: camera, retention, network, analytics and acceptance requirements, with SPF, MOM, IMDA and PUB figures.
Alarm Deduplication for Security Teams: A Practical Guide
How alarm deduplication, correlation rules, severity mapping and escalation matrices work together to cut duplicate alarms without hiding the ones that matter.
Evacuation Muster Reporting: Singapore Site Guide
How to run evacuation muster reporting and roll call on Singapore sites: who counts whom, what the report records, SCDF duties, and how to close the gaps.
API Integration Security for Singapore Security Systems
How to secure API integrations between cameras, access control, visitor and analytics platforms in Singapore: threats, controls, PDPA duties and a rollout checklist.
Let's Build YourSecurity Ecosystem.
Whether you're a System Integrator, Solution Provider, or an End-User looking for trusted advisory, our team is ready to help you navigate the BeyondSensor landscape.
Direct Advisory
Connect with our regional experts for tailored solutioning.