Unlock the power of data with this comprehensive guide to sensor data analysis. Discover best practices for actionable insights and improved decision-making.

Sensor Data Analysis: A Practical Guide for 2026

TL;DR:
- Sensor data analysis converts raw sensor readings into actionable decisions, with proper infrastructure and cleaning being crucial. Effective processing involves edge gateways, stream frameworks, and downsampling to manage large data volumes while removing noise and anomalies. Combining contextual interpretation with regular calibration ensures reliable insights for operational decisions.
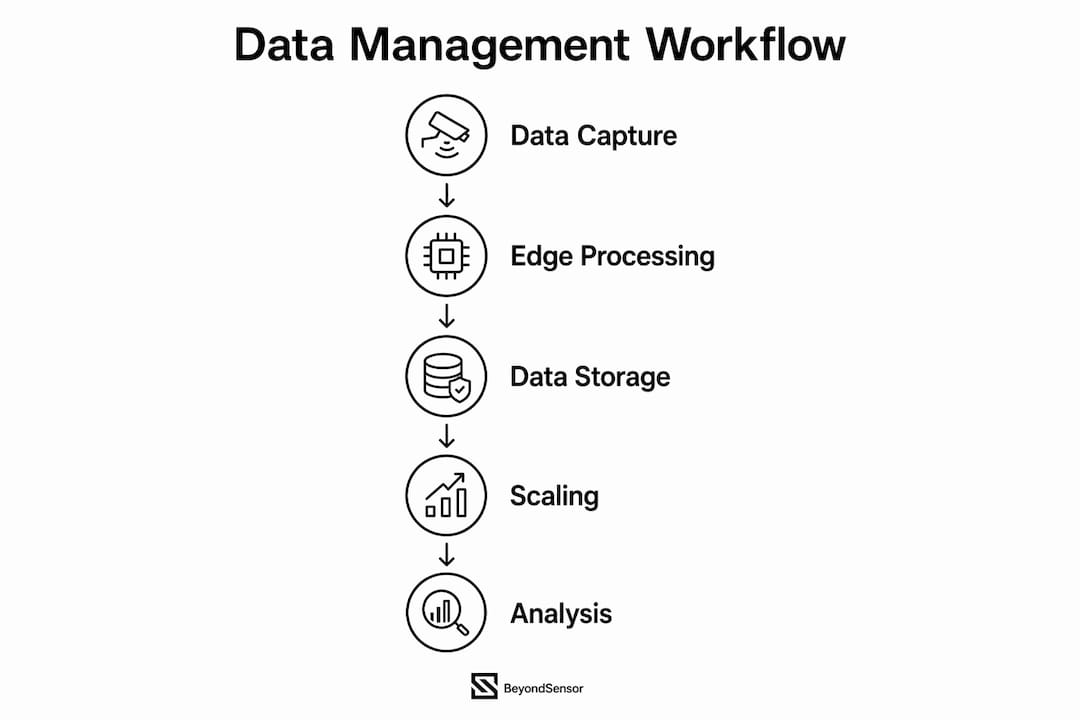
Sensor data analysis is the process of converting raw sensor readings into decisions that operators can act on. Done well, it powers predictive maintenance in factories, air quality monitoring under EPA guidelines, and physical security across smart infrastructure. Done poorly, it produces noise-filled outputs that mislead rather than inform. This guide to sensor data analysis walks through the full workflow: infrastructure, cleaning, feature extraction, and the best practices that separate reliable insights from expensive guesswork. Beyondsensor applies these methods daily across industrial automation, environmental monitoring, and physical security deployments in Southeast Asia.
What are the essential tools and infrastructure for sensor data analysis?
The right infrastructure is the foundation of every effective sensor data workflow. Without it, even the best analytical techniques fail under the weight of data volume and latency demands.
Hardware and streaming layers
Edge gateways sit closest to the sensors and handle the first layer of processing. They filter noise, buffer readings, and forward only relevant data upstream. Stream-processing frameworks like Apache Kafka and Apache Flink handle the next layer, ingesting continuous sensor feeds and routing them to storage or analytics engines. Edge processing is the right choice for time-sensitive anomaly detection because it delivers sub-second latency and cuts bandwidth compared to cloud-only pipelines.

Network conditions add another layer of complexity. Cellular and satellite connections introduce packet delays, so stream pipelines should buffer 0–10 seconds of out-of-order data to avoid dropping or missequencing readings. Ignoring this detail produces gaps and false anomalies that corrupt downstream analysis.
Storage and scaling
Raw sensor data accumulates fast. A moderate setup of 50 sensors recording at 4Hz for six months can exceed 50GB, which overwhelms standard laptops and strains typical databases. The practical fix is downsampling: aggregating raw readings into time-bucketed averages or percentiles. Downsampling raw readings into time-bucketed aggregates reduces storage requirements by 90% or more without losing the signal that matters for decisions.
| Tool category | Best use case | Key trade-off |
|---|---|---|
| Edge gateway | Real-time filtering and local alerting | Limited compute for complex models |
| Apache Kafka | High-throughput data ingestion | Requires tuning for ordering guarantees |
| Apache Flink | Stateful stream processing and windowing | Steeper learning curve than batch tools |
| Time-series database | Compressed long-term storage | Less flexible for ad hoc queries |
| Cloud data warehouse | Historical batch analysis | Higher latency, higher cost at scale |
Pro Tip: Prioritize edge processing for any use case where a delayed alert costs money or safety. Reserve cloud processing for historical trend analysis and model training.
How to clean and preprocess sensor data to handle anomalies and noise
Sensor data is not like financial time series or web logs. Physical-world sensor data carries unique noise patterns: electromagnetic interference, sensor drift over time, and irregular sampling caused by connectivity drops. Each of these requires a different cleaning technique.
Common sensor-specific problems
Sensor drift happens when a device's baseline reading shifts gradually due to temperature changes, aging components, or fouling. Electromagnetic interference introduces sudden spikes that bear no relationship to the actual measured phenomenon. Irregular sampling creates uneven time gaps that break algorithms expecting uniform intervals.
Standard cleaning steps for sensor data include:
- Spike removal: Apply median filtering to replace outlier values while preserving real edges in the signal.
- Missing value handling: Use linear or spline interpolation for isolated missing points where the gap is short.
- Long gap flagging: Flag prolonged absences rather than imputing them. Imputing across a long gap fabricates data and misleads models.
- Drift correction: Apply rolling baseline adjustments or reference corrections when a sensor's zero point shifts over time.
- Schema validation: Check that every incoming record carries the expected fields, units, and timestamp format before it enters the pipeline.
Handling missing data correctly
The distinction between a short gap and a long gap is not cosmetic. Interpolating across a two-second dropout in a vibration sensor is reasonable. Interpolating across a four-hour connectivity failure produces a smooth curve that never existed in the physical world. Effective cleaning distinguishes isolated missing values from prolonged absences and treats them differently. Short gaps get interpolated; long gaps get flagged for human review or excluded from model training.
Pro Tip: Use pattern-based anomaly detection on your cleaned data as a final quality check. Recurring anomaly patterns often signal early sensor degradation, not real events in the environment.
What practical approaches enable effective analysis and feature extraction?
Clean data is the input. Features are what you actually feed into models and dashboards. Feature extraction converts a time series of raw readings into numbers that capture meaningful behavior.
Time-domain and frequency-domain features
Time-domain features are the most accessible starting point. Mean, standard deviation, skewness, and kurtosis describe the shape and spread of a signal over a window. A rising mean in a temperature sensor can indicate equipment warming. A spike in kurtosis in a vibration sensor often precedes bearing failure.
Frequency-domain features require a Fourier transform or wavelet decomposition. They reveal periodic patterns invisible in the raw time series. A pump running at 60Hz that develops a fault often shows a new frequency component at a harmonic of the blade pass frequency. Catching that component early is the difference between planned maintenance and an unplanned shutdown.
Contextual interpretation
Raw values rarely tell the full story. Analysis depends fundamentally on environment and system context, not just numeric outputs. A temperature reading of 85°C means something different in a server room than in an industrial oven. Effective sensor data interpretation layers operational state, environmental conditions, and historical baselines on top of the raw measurement.
Multi-sensor fusion strengthens this further. Complementary filters combine accelerometer and gyroscope readings to produce stable orientation estimates. Fusing air quality sensors with weather data from external APIs gives regulators a cleaner picture of pollution sources. The AI analytics approaches Beyondsensor applies to physical security follow the same logic: no single sensor tells the whole story.
A practical analysis workflow
- Define the question: what decision will this analysis support?
- Select the relevant sensors and time window for that question.
- Apply cleaning and preprocessing as described above.
- Extract time-domain features for a baseline understanding of the signal.
- Add frequency-domain features if periodic behavior is expected.
- Contextualize readings with environmental and operational metadata.
- Apply threshold alerts or statistical anomaly detection for real-time monitoring.
- Validate outputs against known events before deploying to production.
What best practices ensure reliable sensor data-driven decisions?
Reliable decisions from sensor data require more than good algorithms. They require organizational discipline around calibration, data management, and integration.
Calibration and quality control
Raw sensor data is rarely ready for high-stakes decisions without quality control and correction. The EPA's correction equations for PurpleAir air quality sensors are a well-documented example: uncorrected readings can overstate particulate matter concentrations significantly in humid conditions. Every sensor deployment needs a calibration schedule, a reference standard, and a correction protocol. A security data analytics checklist applied at regular intervals catches calibration drift before it corrupts decision-making.
Managing data volume
Data volume is a resource problem as much as a technical one. Basic data wrangling on a 50-sensor, 4Hz, six-month dataset takes 22–28 minutes on a standard 16GB laptop and risks crashes. That is not a workflow that scales to production. Downsampling, aggregation, and tiered storage keep volume manageable without sacrificing analytical depth.
Edge vs. cloud processing trade-offs
| Approach | Latency | Cost at scale | Best for |
|---|---|---|---|
| Edge only | Sub-second | Low bandwidth cost | Real-time alerts, local anomaly detection |
| Cloud only | Seconds to minutes | High at high volume | Historical analysis, model training |
| Hybrid edge and cloud | Sub-second for alerts | Moderate | Production deployments requiring both |
The hybrid approach wins for most production environments. Edge handles the time-critical path; cloud handles the analytical depth that requires historical context.
Integrating external data sources
Sensor readings gain meaning when combined with external context. Integrating weather APIs with environmental sensors, or access control logs with motion sensor feeds, produces richer signals for decision-making. Sensor integration strategies that connect multiple data sources consistently outperform single-sensor pipelines in operational accuracy.
Key takeaways
Effective sensor data analysis requires structured preprocessing, context-aware interpretation, and disciplined infrastructure choices at every stage of the pipeline.
| Point | Details |
|---|---|
| Infrastructure first | Deploy edge gateways and stream processors before scaling sensor counts. |
| Clean for sensor-specific noise | Apply median filtering, interpolation, and long-gap flagging rather than generic time-series methods. |
| Extract features, not just values | Use time-domain and frequency-domain features to surface patterns raw readings hide. |
| Contextualize every reading | Layer environmental and operational metadata on top of numeric outputs before making decisions. |
| Calibrate and correct regularly | Follow quality control protocols like EPA correction equations to keep data reliable over time. |
What I've learned from working with sensor data in the field
The biggest mistake I see analysts make is treating sensor data like any other time series. It is not. Financial data has missing values because markets close. Sensor data has missing values because a cable got wet, a gateway rebooted, or a device drifted out of spec. Those causes matter for how you handle the gap.
The second mistake is underestimating hardware. I have watched teams build sophisticated models on laptops that crash during the data-loading step. A 50GB dataset from a moderate sensor network is not a big data problem in the enterprise sense, but it is absolutely a problem for a 16GB machine running Python. Plan your compute before you plan your algorithm.
The third thing I would push back on is the instinct to automate everything immediately. Automation is the goal, but domain expertise is the prerequisite. An anomaly detection model trained without input from the engineer who knows what the sensor actually measures will flag the wrong things. The best pipelines I have seen combine automated feature extraction with a human review layer for edge cases.
The payoff is real. In industrial security and environmental monitoring, well-built sensor analysis pipelines catch failures weeks before they become incidents. That is not a theoretical benefit. It shows up in maintenance budgets, safety records, and regulatory compliance reports.
— Eumir
Beyondsensor's sensor data solutions for analysts and decision-makers
Beyondsensor builds the hardware-software infrastructure that makes sensor data analysis reliable at scale. From edge gateways that handle real-time filtering to integrated platforms designed for industrial automation and physical security, Beyondsensor's solutions address the full pipeline described in this guide.

Teams working across Singapore, Malaysia, and the Philippines rely on Beyondsensor for sensor data management that meets regional compliance requirements and operational demands. Whether you are building a new sensor network or fixing gaps in an existing one, Beyondsensor's engineering team provides the localized expertise that generic platforms cannot. Visit beyondsensor.com to connect with a specialist and assess your current pipeline.
FAQ
What is sensor data analysis?
Sensor data analysis is the process of converting raw readings from physical sensors into insights that support operational decisions. It covers data ingestion, cleaning, feature extraction, and contextual interpretation.
How do you handle missing values in sensor data?
Use interpolation for isolated short gaps and flag long gaps rather than imputing them. Imputing across long absences creates false data that misleads models and dashboards.
What is the difference between edge and cloud processing for sensor data?
Edge processing delivers sub-second latency for real-time alerts and anomaly detection on-site. Cloud processing suits historical analysis and model training where latency is less critical.
Why does sensor data need special cleaning methods?
Sensor data carries physical-world noise like drift and electromagnetic interference that financial or web time series do not. Standard cleaning methods miss these patterns; median filtering and drift correction address them directly.
How much storage does sensor data typically require?
A setup of 50 sensors recording at 4Hz for six months can produce more than 50GB of raw data. Downsampling into time-bucketed aggregates cuts that volume by 90% or more while preserving the signal needed for analysis.
Recommended
- How Sensors Improve Operational Efficiency in 2026 | News | BeyondSensor
- Industrial Sensor Integration Workflow: 2026 Engineer's Guide | News | BeyondSensor
- Sensing tools guide: Types, accuracy, and security uses | News | BeyondSensor
- Emerging Smart Sensor Applications for Industry in 2026 | News | BeyondSensor
Read More Articles

The Role of Data Privacy in Security Strategy
Discover the role of data privacy in security. Learn how effective governance reduces risks and strengthens your security strategy.

Why Cybersecurity for Sensing Devices Matters in 2026
Discover why cybersecurity for sensing devices is crucial in 2026. Protect your industrial systems and prevent cyber attacks on critical data.

Cyber-Physical Security: What IT and Security Teams Must Know
Discover what is cyber-physical security and why it's essential for IT and security teams. Protect life-critical systems and ensure safety.

What Is Edge Sensing? A Technical Guide for Professionals
Discover what is edge sensing and how it transforms real-time data processing. Learn the benefits for security applications and architecture.
Let's Build YourSecurity Ecosystem.
Whether you're a System Integrator, Solution Provider, or an End-User looking for trusted advisory, our team is ready to help you navigate the BeyondSensor landscape.
Direct Advisory
Connect with our regional experts for tailored solutioning.