Master the industrial sensor integration workflow with our 2026 engineer's guide. Learn to optimize data flow and enhance automation!

Industrial Sensor Integration Workflow: 2026 Engineer's Guide

TL;DR:
- Most industrial sensor deployments fail because the integration workflow is poorly designed, leading to stale data and alert noise. Proper protocol selection, device-to-asset mapping, and staged validation are essential for effective IIoT data pipelines that enable real-time, value-driven automation. Organizational discipline and thorough planning prevent scope creep and ensure predictive maintenance systems gain trust and operational success.
Most industrial sensor deployments fail not because the hardware is wrong, but because the integration workflow behind it was never properly designed. A poorly structured industrial sensor integration workflow produces stale data, unmapped assets, and alert noise that operators learn to ignore. The formal term for this discipline is IIoT data pipeline architecture, and it covers everything from protocol normalization at the edge to delivery into SCADA, MES, and ERP systems. Get it right, and your automation makes decisions in real time. Get it wrong, and your sensors generate cost without generating value.
Table of Contents
- Key Takeaways
- The industrial sensor integration workflow: foundations first
- Executing the sensor data pipeline step by step
- Common pitfalls in sensor workflow integration
- Verifying and validating your integration
- My take on what actually makes integration succeed
- How Beyondsensor supports your sensor integration projects
- FAQ
Key Takeaways
| Point | Details |
|---|---|
| Protocol choice drives architecture | OPC UA serves the OT layer; MQTT handles scalable IT and cloud delivery. Choose based on destination, not preference. |
| Device-to-asset mapping is non-negotiable | Missing this single step causes sensor data to never reach predictive maintenance or management systems. |
| Start in advisory mode | Deploy AI-driven actions in shadow mode first to build operator trust before enabling full automation. |
| ISA-95 boundaries prevent scope creep | Mapping your integration to ISA-95 functional levels keeps responsibilities clear and data flows controlled. |
| Closed-loop workflows deliver real value | Connecting sensor anomalies to work order systems turns monitoring into maintenance and prevents alarm fatigue. |
The industrial sensor integration workflow: foundations first
Before you write a single line of configuration, you need a clear picture of your system architecture. The sensor integration process begins with understanding which physical devices exist on the plant floor, what protocols they speak, and where their data ultimately needs to land.
Most modern industrial environments contain a mix of sensor types: vibration sensors on rotating equipment, temperature and pressure transducers on process lines, flow meters, and proximity switches on conveyance systems. Each may speak a different protocol. Unifying them requires an edge gateway that can ingest multiple device protocols and normalize output before passing data upstream.
Protocol selection is architectural, not tactical. OPC UA and MQTT serve different layers: OPC UA provides rich, browsable semantics suited for SCADA and OT systems, while MQTT delivers lightweight, scalable messaging for IT systems and cloud analytics platforms. Choosing the wrong one for the wrong layer creates integration debt that compounds quickly.
| Protocol | Primary layer | Strengths | Typical destination |
|---|---|---|---|
| OPC UA | OT (Levels 0-2) | Browsable semantics, security model, rich data types | SCADA, historian, MES |
| MQTT | IT/Cloud | Lightweight, pub/sub, scalable | Cloud platforms, ERP, analytics |
| REST/HTTP | Business layer | Familiar, widely supported | ERP, dashboards, reporting |
| Modbus TCP | Legacy OT | Ubiquitous, simple | PLCs, legacy SCADA |
The ISA-95 functional hierarchy divides industrial systems into five levels: Level 0 for physical processes, Level 1 for sensing and actuating, Level 2 for supervisory control, Level 3 for manufacturing execution, and Level 4 for business planning. Mapping your integration strategy to these levels before you begin prevents uncontrolled data flows and clarifies which system owns which responsibility.
Required tools before you begin:
- Edge gateway with multi-protocol support (OPC UA server, MQTT client, Modbus polling)
- Protocol adapter or broker (such as a message queue for decoupling ingestion from delivery)
- Data platform or historian capable of time-series storage
- Device registry or asset management system for device-to-asset mapping
- Network segmentation between OT and IT zones
Pro Tip: Map every physical sensor to a logical asset in your CMMS or asset management system before you start configuring data flows. This mapping is the hidden dependency that determines whether your downstream predictive analytics will actually work.
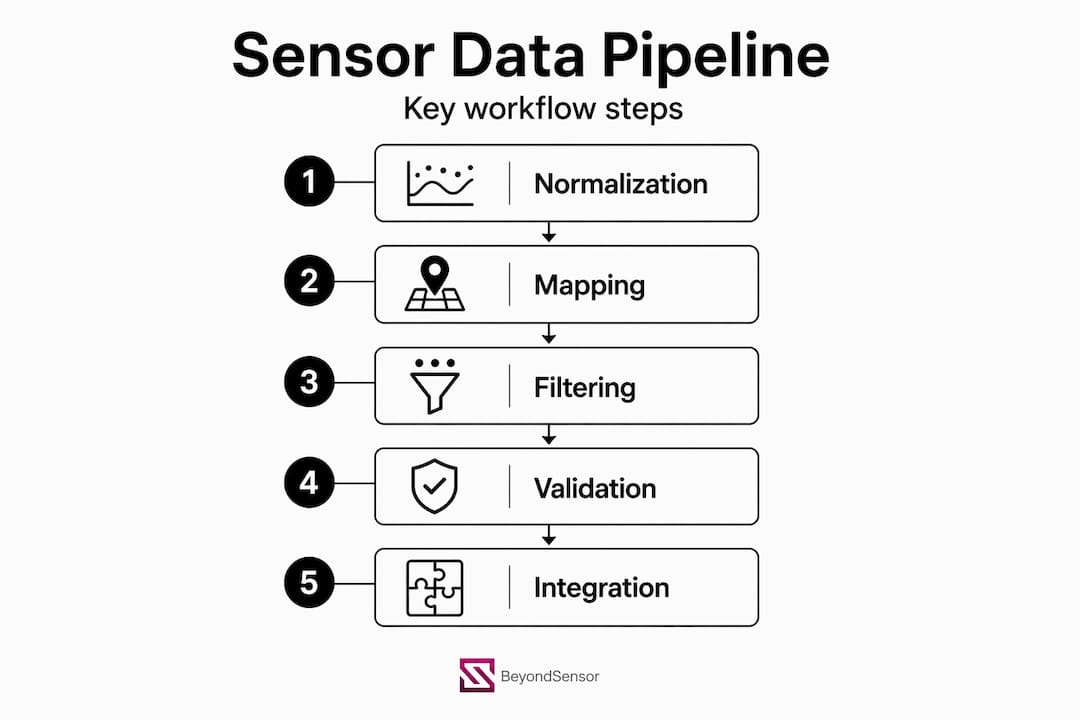
Executing the sensor data pipeline step by step
With architecture defined, the execution phase follows a repeatable sequence. Typical IIoT pipelines require protocol normalization, unit conversion, quality filtering, and contextual enrichment to produce consistent event streams. Skipping any step degrades every downstream use case.
-
Data ingestion and protocol normalization. Configure your edge gateway to poll or subscribe to all device endpoints. Normalize output into a canonical message format, typically JSON or a structured binary format, with consistent field names regardless of source protocol. A temperature reading from a Modbus RTU device and one from an OPC UA node should arrive downstream looking identical.
-
Contextual enrichment and device-to-asset mapping. Attach metadata to every event: asset ID, location, engineering unit, and sensor type. Missing device-to-asset mapping is one of the most common causes of predictive maintenance failures. Without it, sensor readings arrive at your analytics platform with no connection to the physical asset they describe.
-
Temporal aggregation and quality filtering. Apply time-window aggregations where appropriate (one-minute averages for trending, raw samples for anomaly detection). Filter out readings that fall outside physically plausible ranges, flag communications errors, and mark records with quality codes. Early normalization and timestamp validation at the edge prevents analytics errors downstream that are expensive to trace and fix.
-
Transformation logic using streaming SQL. Define materialized views or streaming queries that compute derived metrics: equipment efficiency ratios, delta temperatures, cumulative flow totals. This keeps transformation logic declarative and auditable rather than buried in custom scripts.
-
Delivery to downstream systems. Route enriched, quality-filtered events to their target systems. SCADA and historians receive high-frequency raw data via OPC UA. MES systems receive production events and quality triggers. Bidirectional MES and ERP integration captures scheduling data flowing down and production actuals flowing up, which one-directional approaches miss entirely.
| Pipeline stage | Input | Output | Key risk if skipped |
|---|---|---|---|
| Protocol normalization | Raw device messages | Canonical JSON events | Incompatible formats break downstream consumers |
| Contextual enrichment | Anonymous sensor readings | Asset-linked, tagged events | Predictive analytics cannot identify equipment |
| Quality filtering | All sensor samples | Validated, flagged records | Bad data corrupts historian and model training |
| Streaming transformation | Raw events | Derived metrics, aggregations | Dashboards show raw noise, not operational insight |
| Delivery routing | Processed events | System-specific payloads | Downstream systems receive wrong format or frequency |
Pro Tip: Validate timestamp accuracy at the edge, not the cloud. Network latency and clock drift on PLCs can silently shift event timestamps by seconds or minutes, making time-series correlation and anomaly detection unreliable. Implement NTP synchronization on every edge device and log ingestion lag as a monitored metric.
You can learn more about how sensor technology drives automation at the data pipeline layer in environments where multiple sensor types converge on a single workflow.
Common pitfalls in sensor workflow integration
Even well-planned integrations run into predictable problems. Recognizing them early saves weeks of troubleshooting.

Over-integration and data freshness mismatches are more common than under-integration. Teams connect every available sensor to every available system, then discover that a SCADA historian sampling at 100ms and an ERP system polling at 15-minute intervals create irreconcilable data freshness expectations. The fix is to define the required update rate for each destination before configuring any feed.
Alarm fatigue is the silent killer of smart sensor deployment value. When sensor alerts arrive without assigned owners, defined escalation paths, or audit trails, operators stop responding to them. Workflow automation semantics require four components: a trigger condition, an assigned owner, a defined action, and an audit record. Industrial monitoring platforms that route alerts with these properties eliminate the need for ad hoc development and prevent alert noise from overwhelming operations teams.
Scope creep is the architectural enemy of the industrial sensor maintenance workflow. Teams begin with a targeted pilot: vibration monitoring on five compressors. By month two, they have connected 40 asset types across three plants with no unified data model. ISA-95 boundaries exist precisely to prevent this. Enforce them deliberately.
"Closed-loop predictive maintenance requires bidirectional sensor integration to work orders. Without it, you have monitoring. With it, you have maintenance." This distinction matters to every operations manager who has watched a dashboard predict a failure that maintenance never acted on.
Troubleshooting checklist when data does not appear in downstream systems:
- Confirm device-to-asset mapping exists in both the edge gateway and the target CMMS
- Check that the edge gateway's OPC UA server certificate is trusted by the SCADA client
- Verify MQTT broker topic structure matches the subscriber's expected filter
- Inspect quality codes on ingested records for out-of-range or communications-error flags
- Confirm timestamp format and time zone match the historian's ingestion requirements
- Review ISA-95 level boundaries to confirm the data flow crosses the correct integration point
Pro Tip: Log every rejected record during quality filtering to a separate audit table. Most teams discard these silently and then spend days wondering why their equipment utilization metrics look wrong.
Verifying and validating your integration
Deploying a sensor pipeline is not the end of the sensor integration process. Verification confirms the pipeline works. Validation confirms it delivers operational value.
-
Monitor ingestion lag continuously. Track the time delta between a sensor event timestamp and its arrival in the historian or analytics platform. Sustained lag above your defined threshold means a bottleneck exists somewhere in the pipeline, whether at the edge gateway, message broker, or ingestion API.
-
Link sensor anomalies to maintenance workflows. Predictive maintenance systems must connect sensors, AI engines, and CMMS work orders tightly. An anomaly detection model that generates a score but does not trigger a work order or notification delivers no operational value.
-
Deploy AI model outputs in advisory mode first. Successful integration workflows connect AI predictions to reject, rework, or traceability records but begin in shadow mode, where the system recommends without acting, so operators can validate accuracy before trusting automation. This phase typically runs for two to four weeks and is critical for building organizational confidence.
-
Define and track integration health KPIs. Your key performance indicators should include: ingestion success rate (target above 99.5%), data latency (95th percentile), asset coverage ratio (sensors mapped to assets versus total sensors), alarm response rate (alerts acted on versus total alerts), and model prediction accuracy over time.
-
Build feedback loops for continuous improvement. Closed-loop integration means the outcome of a maintenance action feeds back into the AI model's training data. Work order completion records, failure codes, and repair durations should flow back to the analytics layer to retrain models and improve prediction accuracy.
Pro Tip: Run a quarterly integration audit. Map every active sensor feed against its downstream consumer and delete or archive feeds that have no active consumer. Orphaned data flows inflate storage costs and create confusion during troubleshooting.
My take on what actually makes integration succeed
I've worked through enough sensor integration projects to know that the technical pieces rarely fail on their own. The protocol configurations work. The edge gateway publishes data. The historian stores records. What breaks the workflow is almost always organizational, not technical.
The most underestimated failure point I see repeatedly is incomplete device-to-asset mapping. Engineers configure the data pipeline correctly, but nobody updates the asset registry when equipment is replaced or relocated. Six months later, predictive analytics is training on data from a motor that no longer exists at that tag ID. The system's predictions become unreliable, and the operations team stops trusting it. That loss of trust is harder to recover from than any technical failure.
My other hard-won lesson is about shadow mode. Teams resist it because it feels slow. Managers want automation live immediately. But I've seen automated rejection systems act on poorly validated models and pull good product off the line for two weeks before anyone investigated. The advisory phase is not a delay. It is the phase where you prove the system is right before it acts.
The role of physical security workflows in industrial environments is also shifting in ways that affect how you design your sensor architecture from day one. Security and operational sensor data are converging on shared infrastructure, and integration architects who account for both early will avoid expensive redesigns later.
— Eumir
How Beyondsensor supports your sensor integration projects

Beyondsensor builds tools and AI solutions specifically designed for the complexities of industrial sensor deployment and workflow automation. Whether you are a system integrator configuring multi-protocol pipelines or a facility owner connecting sensor data to predictive maintenance workflows, Beyondsensor's platform covers real-time data normalization, event processing, and AI-driven anomaly detection from edge to enterprise. The integration tools at Beyondsensor are purpose-built to handle the protocol translation, contextual enrichment, and downstream delivery challenges covered in this guide. For teams that need AI solutions tailored to their integration architecture, the system integrator solutions page outlines how Beyondsensor supports complex deployments across Southeast Asia and beyond.
FAQ
What is an industrial sensor integration workflow?
An industrial sensor integration workflow is the structured process of ingesting sensor data from plant-floor devices, normalizing it through protocol adapters and edge gateways, enriching it with asset context, and delivering it to operational systems like SCADA, MES, and ERP for real-time analysis and decision-making.
What protocols are used to integrate industrial sensors?
OPC UA is the standard protocol for OT-layer integration with SCADA and historians, while MQTT is widely used for lightweight, scalable delivery to IT systems and cloud platforms. Most industrial automation workflows require both, with an edge gateway handling protocol translation between them.
Why does device-to-asset mapping matter so much?
Without device-to-asset mapping, sensor readings arrive at analytics and maintenance platforms with no connection to the physical equipment they describe. This single missing link causes predictive maintenance models to fail and work order automation to never trigger.
How do you validate a sensor integration before going live?
Deploy AI model outputs in advisory mode for two to four weeks, monitoring recommendations without acting on them. Track ingestion lag, data quality rates, and alarm response rates against defined KPIs before enabling any automated actions.
What is the biggest cause of sensor integration failure?
Scope creep and incomplete asset mapping are the two most common causes. Enforcing ISA-95 functional boundaries during design prevents uncontrolled data flows, while maintaining an accurate device registry prevents downstream analytics from training on stale or misidentified asset data.
Recommended
- Step-by-Step Security Integration: Advanced Sensor Guide | News | BeyondSensor
- How sensor technology drives smarter industrial automation | News | BeyondSensor
- Intelligent sensing deployment process: A guide for tech leaders | News | BeyondSensor
- The Role of Sensors in Infrastructure: 2026 Guide | News | BeyondSensor
Read More Articles

Sensor Integration Architecture Explained for System Architects
Discover what is sensor integration architecture and how it builds a robust foundation for efficient data handling and smart systems.

The Role of Data Analytics in Security Operations
Discover the vital role of data analytics in security operations. Learn how it enhances threat detection and response for effective protection.

What Is Sensor Fusion Technology? A 2026 Guide
Discover what is sensor fusion technology in our 2026 guide. Learn the intricate algorithms behind it and its real-world applications today!

The Role of Sensors in Infrastructure: 2026 Guide
Discover the vital role of sensors in infrastructure for 2026. Learn how integration transforms data into predictive maintenance solutions!
Let's Build YourSecurity Ecosystem.
Whether you're a System Integrator, Solution Provider, or an End-User looking for trusted advisory, our team is ready to help you navigate the BeyondSensor landscape.
Direct Advisory
Connect with our regional experts for tailored solutioning.