
Practitioners: 6 Steps to Choose Environmental Sensors, Avoid Mistakes
Six decision steps for monitoring teams to pick, site, and deploy environmental sensors, with pilot, calibration, and sourcing advice.
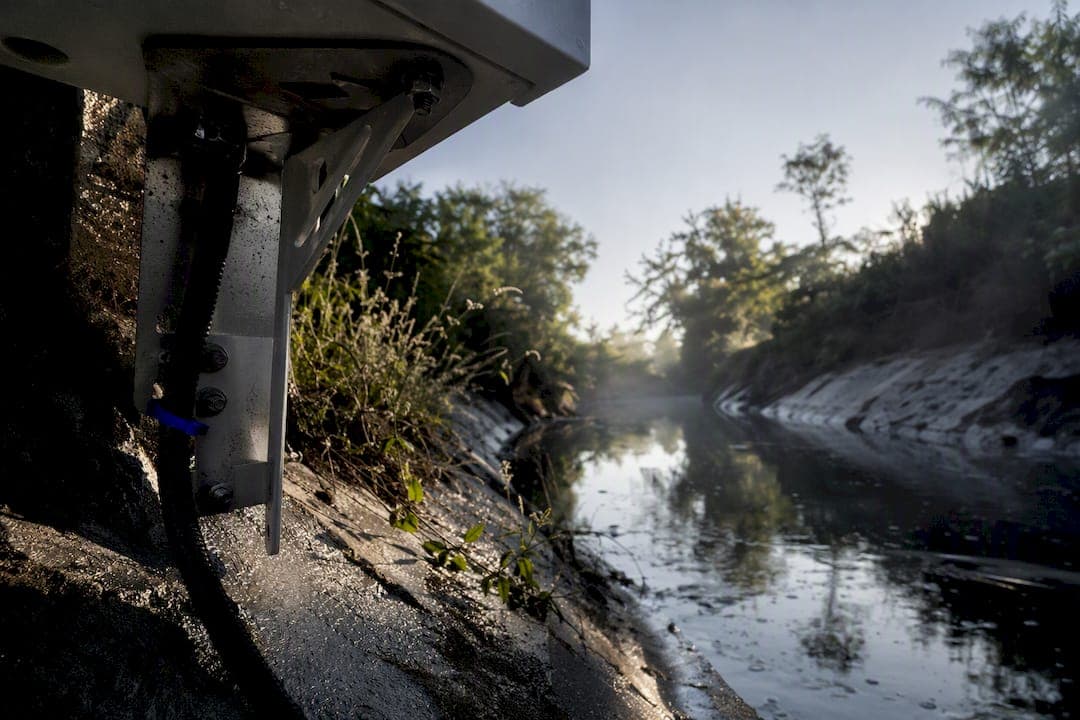
Practitioners: 6 Steps to Choose Environmental Sensors, Avoid Mistakes
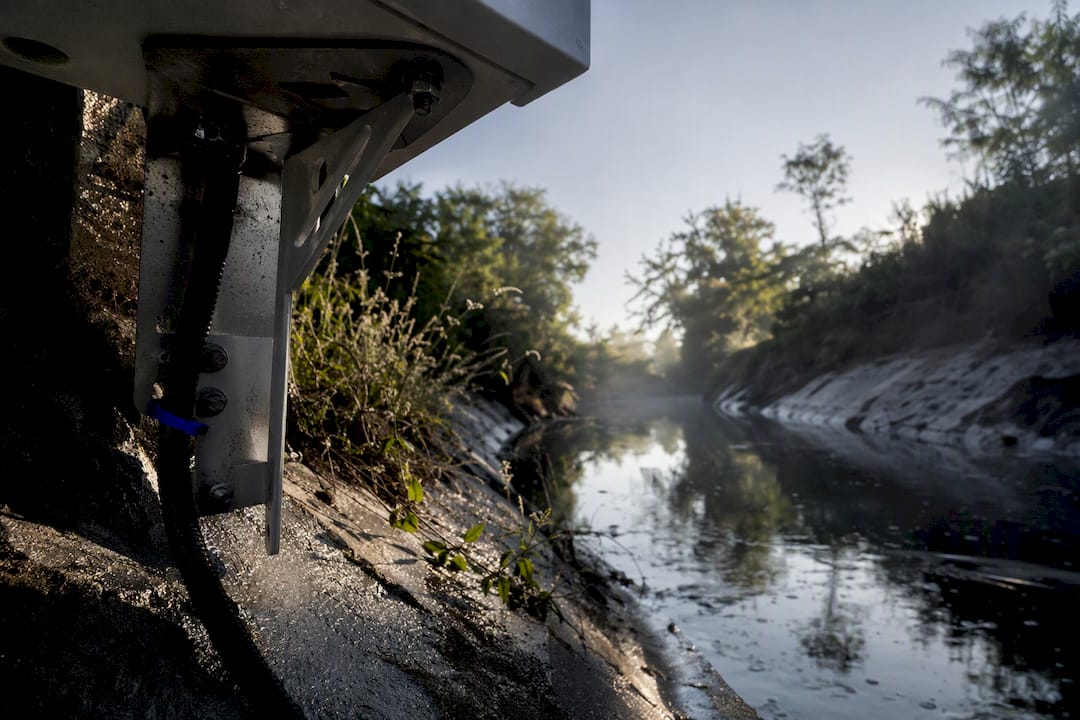
Environmental monitoring sensors are devices that detect and measure physical or chemical conditions, such as air pollutants, water quality, soil moisture, weather variables, noise, and radiation. This guide walks through the main sensor categories, the parameters they output, where each one fits operationally, and how to choose and deploy hardware that holds up to real-world conditions instead of just spec-sheet promises.
TL;DR:
- Sensor choice must align with the specific detection goals, such as particulate matter or gas monitoring, to avoid procurement mistakes.
- Calibration, certification, and proper siting are critical to collect data that is reliable for regulation or decision-making purposes.
- Regulatory projects require traceable calibration and frequent validation, while community monitoring can accept noisier data with lower accuracy.
- Deployment considerations like power, connectivity, and avoiding biasing locations are essential to maintain data integrity over time.
- Starting with a pilot program to validate sensor performance and calibration prevents downstream issues and ensures data trustworthiness.
Table of Contents
- Types of Environmental Monitoring Sensors
- Key Parameters and How to Read Sensor Output
- Where Environmental Sensors Actually Get Used
- How to Choose the Right Sensors for the Job
- Getting Deployment Right: Power, Siting, and Data Integrity
- A Practical Pilot-to-Scale Workflow for Sensor Networks
- What Most Monitoring Programs Get Backward
- Deploying Sensors Without Reinventing Your Own Supply Chain
- Sources
- FAQ
Types of Environmental Monitoring Sensors
Every monitoring program starts with the same question: what exactly are you trying to detect, and at what resolution? The answer determines which sensor category you need, and mixing that up is the single most common procurement mistake we see.
Air quality sensors split into two families. Optical particle counters measure PM1, PM2.5, PM4, and PM10 by scattering light off airborne particles, while electrochemical or metal-oxide cells target specific gases like NO2, CO, O3, SO2, and H2S. A compact platform like the Sensirion SEN69C packages particulate detection alongside VOC index, NOx index, CO2, and formaldehyde sensing into a single module, which is why so many indoor air quality builds now start from one chip instead of five.
Meteorological sensors cover temperature, relative humidity, barometric pressure, wind speed and direction, and rainfall. These rarely stand alone. Wind and rain data almost always accompany air quality readings, because dispersion and dilution change the meaning of a pollutant spike.
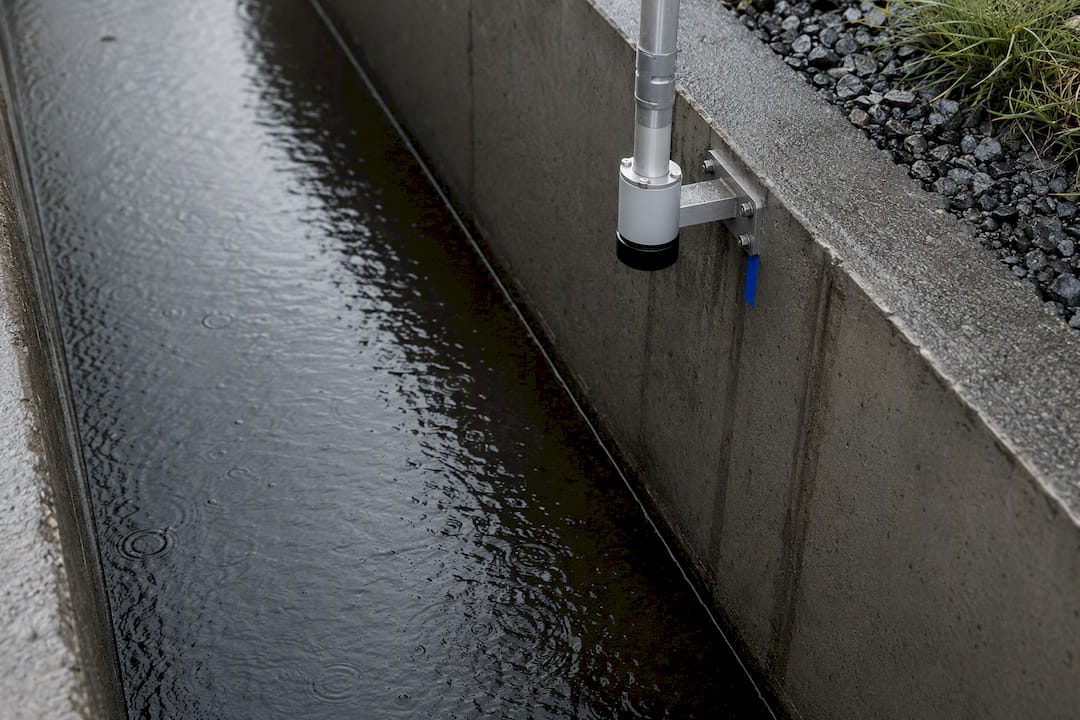
Water sensors measure level (via pressure transducers, ultrasonic, or radar), turbidity, pH, dissolved oxygen, and conductivity. Flood-focused platforms such as SensiFlood pair immersible or non-contact level sensors with cellular, satellite, or mesh communication fallback, so a single downed cell tower does not blind an early-warning network during the exact storm it was built to catch.
Soil sensors track moisture, temperature, and sometimes conductivity or nutrient proxies, feeding irrigation decisions and erosion studies.
Noise and vibration sensors log sound pressure level in decibels (typically dBA weighted) and structural vibration, common on construction sites bound by permit noise limits.
Radiation sensors detect gamma or beta radiation using Geiger tubes or scintillation detectors, mostly in industrial, medical, or nuclear-adjacent settings.
A few practical notes on tradeoffs:
- Low-cost optical and electrochemical sensors work well for dense, indicative networks but drift over time and generally need co-location against reference instruments before their data can support quantitative claims.
- Reference-grade instruments cost far more and need more maintenance, but they are the only credible option when a regulator or client contract demands defensible numbers.
- Modular multi-parameter stations, like the Sensorbee Air Pro 2, combine particulate, gas, noise, and vibration sensing in one enclosure. That consolidation matters most on construction or industrial sites, where hauling five separate instruments to one fence line is its own logistics problem.
Key Parameters and How to Read Sensor Output
Reading a sensor feed without knowing its units is how good data gets misinterpreted. PM2.5 and PM10 are reported in micrograms per cubic meter (µg/m³), and both matter for health because particle size determines how deep they penetrate the respiratory tract. VOC index and NOx index are unitless scores, typically scaled 0 to 500, that track relative change rather than an absolute concentration. Gas species like NO2, CO, and O3 are usually reported in parts per billion or parts per million, depending on the sensor's detection range.
Temperature and relative humidity readings need each other to mean anything. A humidity sensor's accuracy shifts with temperature, and many gas sensors need temperature and RH compensation built into their firmware or they will drift under seasonal swings. Barometric pressure, measured in hectopascals, factors into altitude corrections and short-term weather forecasting.
Water quality parameters include level (meters or centimeters), turbidity (nephelometric turbidity units), pH (0 to 14 scale), and conductivity (microsiemens per centimeter, a rough proxy for dissolved salts). Noise data is logged in decibels, almost always A-weighted (dBA) to match human hearing sensitivity.
Four specs decide whether a sensor fits your use case:
| Spec | What it tells you |
|---|---|
| Accuracy | How close a reading is to the true value, often ±10% for PM sensors |
| Detection limit | The smallest concentration the sensor can reliably register |
| Response time | How fast the sensor reacts to a real change in conditions |
| Measurement range | The upper and lower bounds the sensor can report without saturating |
A sensor with a wide measurement range but poor accuracy is fine for trend-spotting. It is useless for compliance reporting.
Where Environmental Sensors Actually Get Used
Sensor selection changes completely once you attach it to a real objective. A city air quality network and a construction dust monitor might both measure PM2.5, but they need different sample rates, different alert thresholds, and often different levels of certification.
- Urban air quality monitoring relies on networks of PM and gas sensors, often used in dense networks for building pollution maps and tracking trends relative to public health guidelines.
- Construction dust monitoring typically uses fence-line PM sensors with real-time alerting, since many permits require notification within minutes of a threshold breach, not a daily average.
- Industrial fence-line monitoring combines gas-specific sensors (SO2, H2S, VOCs) with continuous logging to demonstrate permit compliance and operational oversight and catch fugitive emissions before they become a regulatory incident.
- Water and flood monitoring pairs level sensors with rainfall data to drive early-warning alerts, where response time matters more than laboratory-grade accuracy.
- Agricultural monitoring uses soil moisture and weather sensors to time irrigation and reduce water waste, generally tolerating lower precision in exchange for lower per-node cost.
- Smart building monitoring tracks CO2, VOC, temperature, and humidity to manage ventilation and occupant comfort, feeding building automation rather than a public dashboard.
- Research deployments often demand the highest accuracy and full metadata logging, since a single questionable dataset can undermine an entire study.
Regulatory reporting and indicative monitoring differ in one key way: regulatory data needs traceable calibration and an auditable chain, while indicative or community monitoring tolerates more noise in exchange for density and cost savings. Sample cadence follows the same logic. A compliance station might log every minute; a community air quality node might sample every 15 minutes and still be perfectly useful for trend analysis.
How to Choose the Right Sensors for the Job
Start with the decision the data needs to support, not the sensor catalog. If a regulator has to accept the numbers, work backward from that requirement before comparing specs.
- Define the decision first. Are you triggering an alert, satisfying a permit, or just building a trend line? Each answer points to a different accuracy and certification tier.
- Match accuracy to intended use. Indicative networks can run on ±10% to ±15% accuracy; compliance work usually needs certified instruments, such as MCERTS-certified PM monitoring for ambient particulate reporting.
- Check calibration and certification. Ask whether the unit ships with a traceable calibration certificate and what the recommended recalibration interval is.
- Confirm connectivity and data format. Does the sensor speak a format your dashboard or database already ingests, or will you need a custom parser?
- Price out maintenance, not just hardware. Filters, gas module replacements, and site visits often cost more over three years than the initial unit.
- Build a supplier checklist. Ask for sample calibration certificates, firmware update history, and mean time between failures before signing a purchase order.
Pro Tip: Ask any vendor for a real calibration certificate before you buy, not a generic spec sheet. A certificate tied to a traceable national standard is the difference between a number you can defend in an audit and one you can only defend in a meeting.
Getting Deployment Right: Power, Siting, and Data Integrity
A sensor with excellent specs still produces bad data if it is mounted next to an exhaust vent or starved for power during a cloudy week. Deployment planning is where most monitoring programs quietly fail.
Connectivity choice depends on who operates the network. Public cellular options like NB-IoT and LTE-M suit quick, remote deployments where you don't want to manage your own radio infrastructure, while private LoRaWAN networks fit dense urban deployments run by a single operator across many nodes. Wi-Fi works fine for fixed indoor installations with existing infrastructure; wired connections remain the most reliable option for permanent industrial stations.
Power planning matters more in the field than in the datasheet. Solar-powered nodes need battery sizing that accounts for the worst realistic stretch of cloud cover in your region, not the average. Sleep strategies that reduce sampling frequency overnight can extend battery life significantly without sacrificing decision-relevant data.
Siting mistakes bias readings before a single number is even wrong on paper: mounting an air sensor near a loading dock, a water level sensor in a location prone to debris blockage, or a noise sensor against a reflective wall all skew results systematically.
- Keep air sensors away from direct exhaust, cooking vents, and reflective surfaces that trap heat.
- Mount water level sensors where debris and ice cannot interfere with the sensing path.
- Verify calibration on receipt and again at the manufacturer's recommended interval, not just when a reading looks suspicious.
- Log timestamps in a consistent time zone and encrypt data in transit to preserve chain-of-custody for any dataset headed toward regulatory review.
- Document gaps and drift rather than silently interpolating them, since an unexplained gap in raw data is far less damaging than an unexplained gap discovered later in an audit.
A Practical Pilot-to-Scale Workflow for Sensor Networks
The organizations that get clean, defensible data almost always run a pilot before they commit to a full network. Pilot phases should fix the parameters that matter, choose one or two representative sites, and record a baseline before any alerting logic goes live.
Validation follows: co-locate new sensors against reference instruments, confirm calibration certificates match the units actually deployed, and document any correction factors in writing. Scaling introduces its own demands, including remote device management, a fixed maintenance schedule, and clear service-level expectations for uptime and response time.
- Pilot: pick parameters, select 1 to 2 representative sites, capture baseline readings before scaling.
- Validate: co-locate with reference instruments, confirm calibration certificates, log correction factors.
- Scale: set a maintenance calendar, assign remote monitoring responsibility, define SLA response times for outages.
What Most Monitoring Programs Get Backward
Most teams buy sensors first and decide what to do with the data second. That sequence is backward, and it explains why so many monitoring programs end up with terabytes of readings nobody trusts. Define the decision the data has to support before you evaluate a single spec sheet, run a real pilot with co-located reference checks, and treat calibration traceability as core infrastructure rather than a paperwork afterthought. Skip that discipline and no amount of sensor density fixes it later.
— Eumir
Deploying Sensors Without Reinventing Your Own Supply Chain
Buying the right sensor is only step one. Getting it calibrated, integrated with the platform your team already uses, and connected to a supplier network that actually stocks replacement modules is where most in-house projects stall out. BeyondSensor provides integration services that help connect sensor hardware with functional monitoring programs, offering sourcing and deployment support to streamline project implementation.

For a pilot project, Solution Integration covers the pilot-to-scale workflow directly: parameter selection, co-location validation, and calibration documentation handled as one engagement rather than five separate purchase orders. If your gap is sourcing the right sensor OEMs, gas modules, or cloud partners for a larger deployment, Ecosystem Matchmaking connects you to the right suppliers without months of vendor discovery calls. Start by outlining your monitoring objective and reaching out through the Beyondsensor landing page to scope a pilot.
Sources
FAQ
What types of sensors are used in environmental monitoring?
The main categories are air quality (particulate and gas), meteorological (temperature, humidity, pressure, wind, rainfall), water (level and quality), soil, noise and vibration, and radiation sensors, often combined into modular multi-parameter stations.
What are five types of environmental monitoring?
Five common categories are air quality monitoring, water quality and flood monitoring, soil monitoring, noise and vibration monitoring, and meteorological monitoring, each using a distinct set of sensor technologies.
What are some examples of environmental sensors?
Examples include optical particle counters for PM2.5 and PM10, electrochemical cells for NO2 and CO, pressure or ultrasonic transducers for water level, and integrated platforms like the Sensirion SEN69C or the MCERTS-certified Sensorbee Air Pro 2.
What are environmental sensors?
Environmental sensors are devices that detect physical or chemical changes in air, water, soil, or the surrounding environment and convert those changes into measurable data for monitoring or alerting.
Does Beyondsensor help with environmental sensor deployment?
Yes. Beyondsensor supports environmental monitoring projects through solution integration for pilot-to-scale deployments and ecosystem matchmaking to source sensor hardware and cloud partners.
Recommended
Read More Articles
Stop Silent Failures: Sensor Health Monitoring for Ops & Procurement
Procurement and ops: require heartbeat intervals, drift limits, PDR targets, and network security to stop silent sensor failures.
Secure AI Model Drift in 90 Days: Six Actions for Security Teams
Stop AI model drift breaking security controls. Six actions to finish in 90 days, with monitoring metrics, procurement SLAs, and incident response steps.
5 ONVIF profile checks every integrator must run before buying cameras
Default to Profile T for new cameras. Add Profile G for local recording and Profile M for analytics. Verify each model on the ONVIF Conformant Products...

Plan 12–18 Month Retraining: Smart City Surveillance for Planners
Practical guidance for planners deploying smart city surveillance: pilot narrowly, with privacy by design, and budget 12–18 months for retraining.
Let's Build YourSecurity Ecosystem.
Whether you're a System Integrator, Solution Provider, or an End-User looking for trusted advisory, our team is ready to help you navigate the BeyondSensor landscape.
Direct Advisory
Connect with our regional experts for tailored solutioning.